Today we will walk-through a simple experiment in Azure Machine Learning Studio that will detect anomalies in IoT measurements. We will use the data for telemetry like temperature, humidity, soil moisture and pH level being collected from the IoT devices which are connected with Azure IoT Central.
We will use Anomaly Detection algorithm for our solution that comes with Azure Machine Learning and is useful for detecting different types of anomalous patterns in time series data.
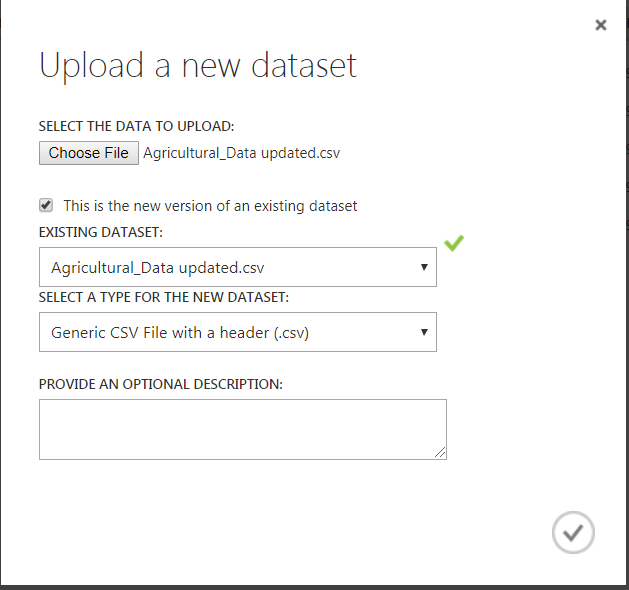
So, in the first step we will upload the dataset on Azure Machine Learning Studio in the CSV file format. In order to do that, open Azure Machine Learning home page and Click +NEW at the bottom of the window -> Select DATASET -> Select FROM LOCAL FILE.

In the Upload a new dataset dialog, click Browse, and find the Agricultural_Data updated.csv file you created.
Now in the next step we will create an experiment in Machine Learning Studio that uses the dataset you uploaded. So, click +NEW at the bottom of the window and Select EXPERIMENT, and then select “Blank Experiment”.

Select the default experiment name at the top and rename it to IoT Measurements and in the module palette to the left of the experiment page, expand Saved Datasets. Find the dataset you created under My Datasets and drag it onto the main page.

Now let’s prepare the data by using Apply SQL Transformation which was used to separate out the timestamps by date and time using SQLite.

After Apply SQL Transformation, we will search and drag Select Columns in Dataset, and in the Properties pane to the right page, click Launch column selector and select the following columns:
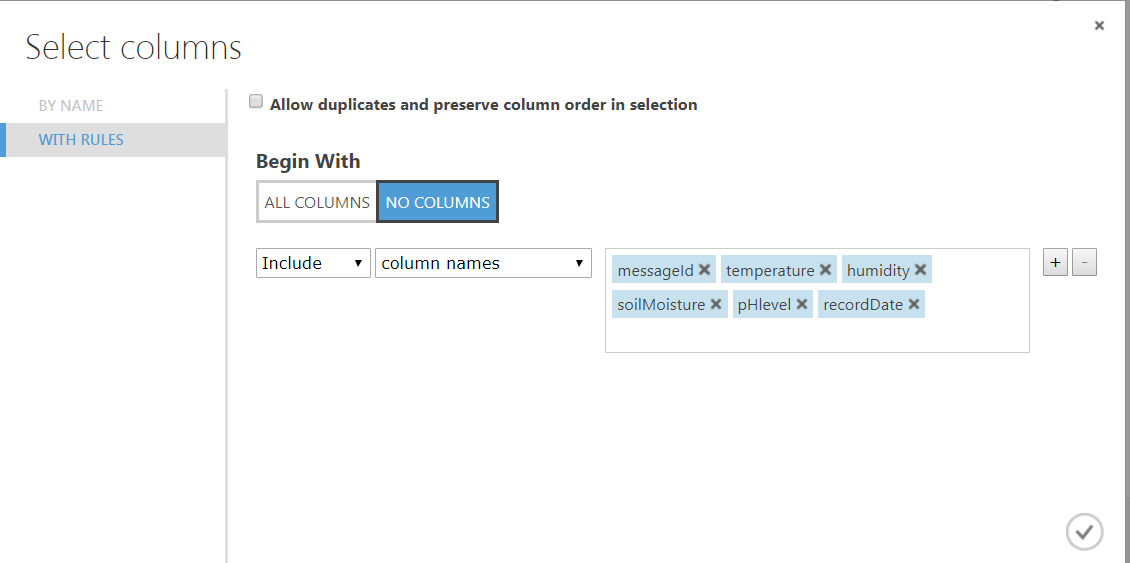
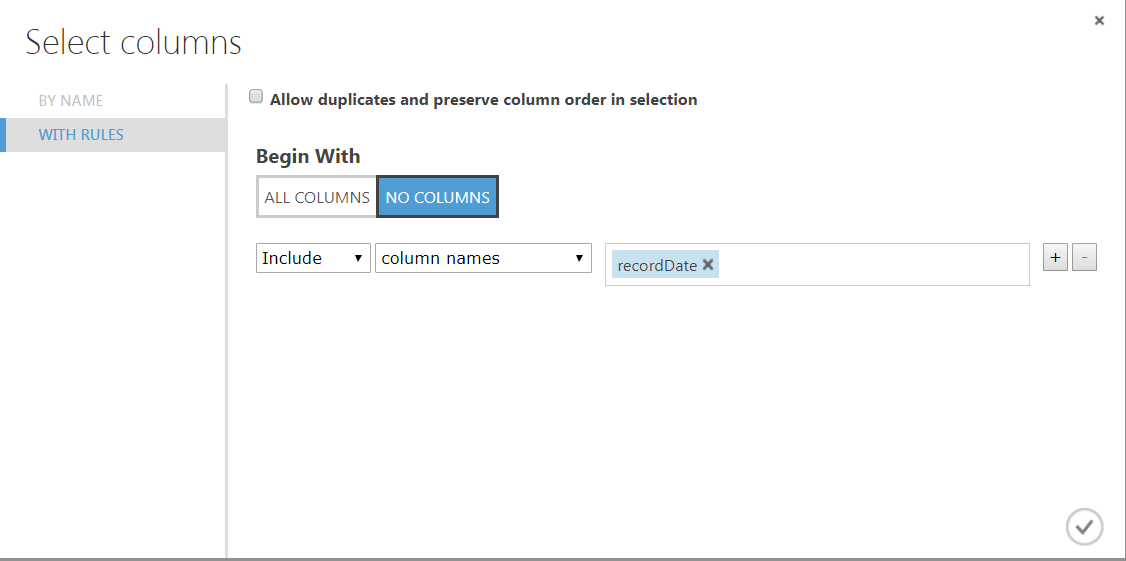
Next, In the module palette, Search and drag Edit Metadata onto the main page and connect the Select Columns in dataset to the Edit Metadata. Select Edit Metadata, and in the Properties pane to the right page, click Launch column selector and select the following column:
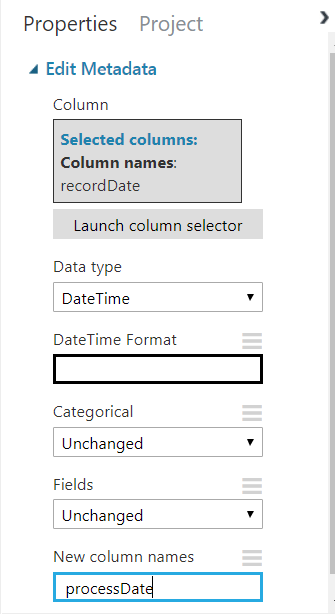
Now, back in the Properties pane, we will look for the New column names parameter. In this field, enter processDate in new column names and select DateTime as our data type.
So, now in the next step we will apply separate Time Series Anomaly Detection for Temperature, Humidity, Soil Moisture and pH Level, which we mean to identify the increase or decrease of each of these variables and to evaluate against various parameters of the anomaly detection module.
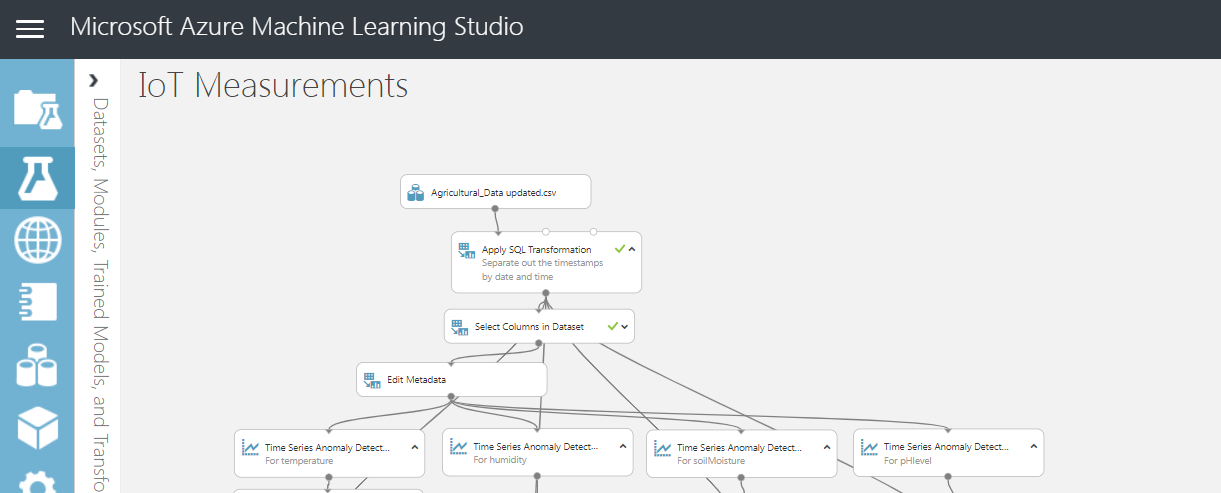
After we applied separate Time Series Anomaly Detection for Temperature, Humidity, Soil Moisture and pH Level, you can get the result using R code which you can find and drag the Execute R Script module onto the experiment page and connect the output port of the time series anomaly detection to the first input port of the Execute R Script module and at the same time connect the output port of the Apply SQL Transformation to the second input port of the Execute R Script module.
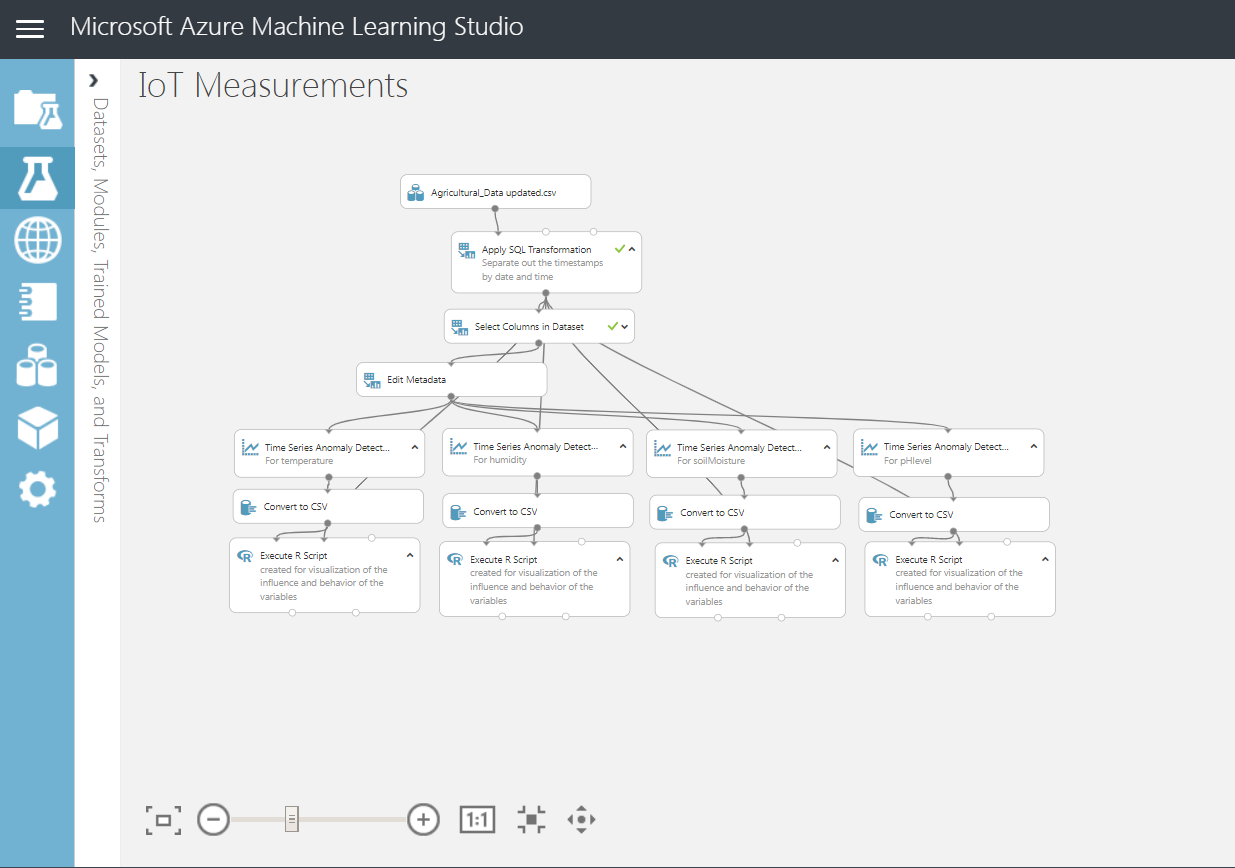
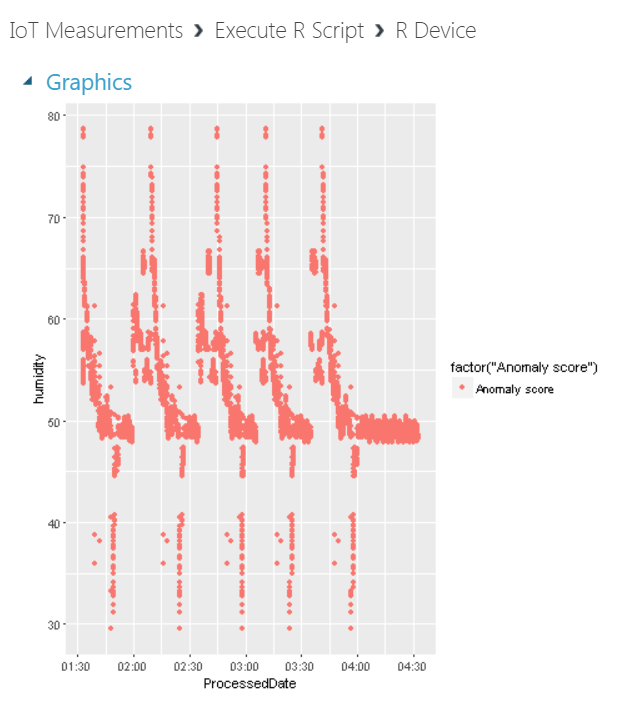
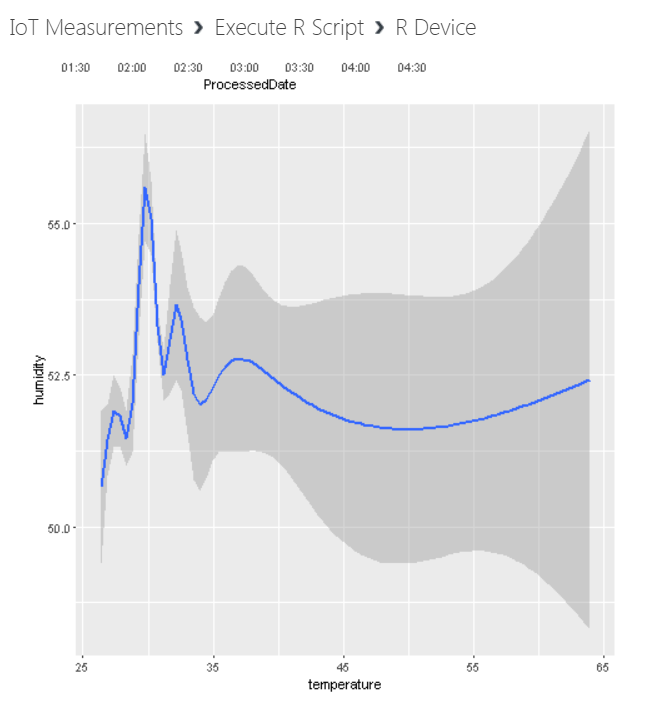
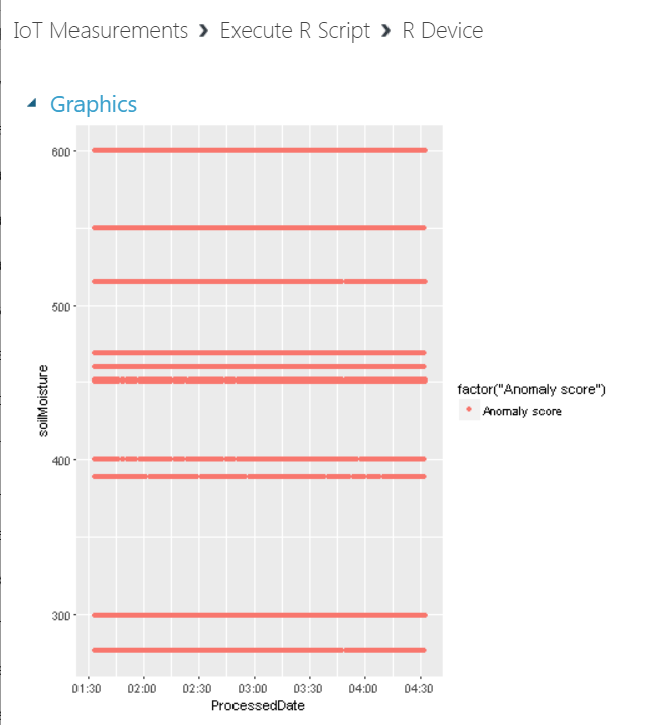
Note: The purpose of creating the RScripts is for visualization of the influence and behavior of the variables.
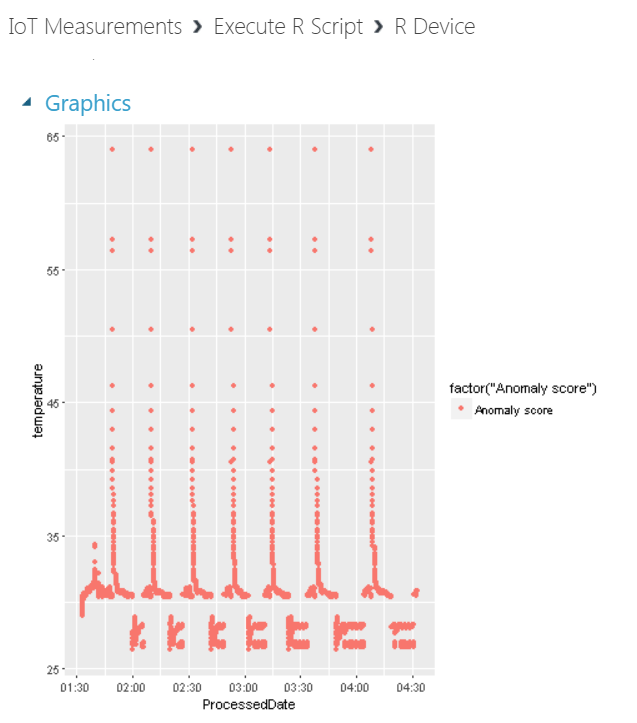
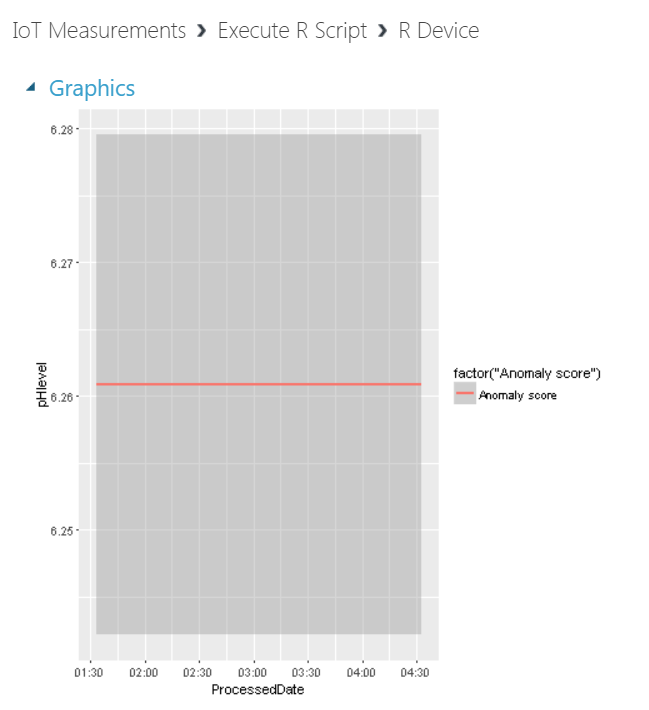
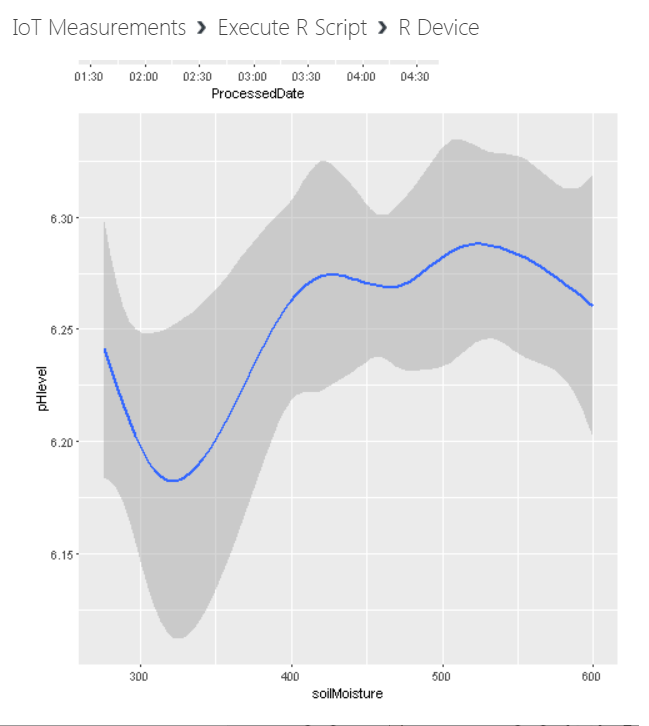
Now we can see the visualization and the behavior of all variables:
For Temperature:
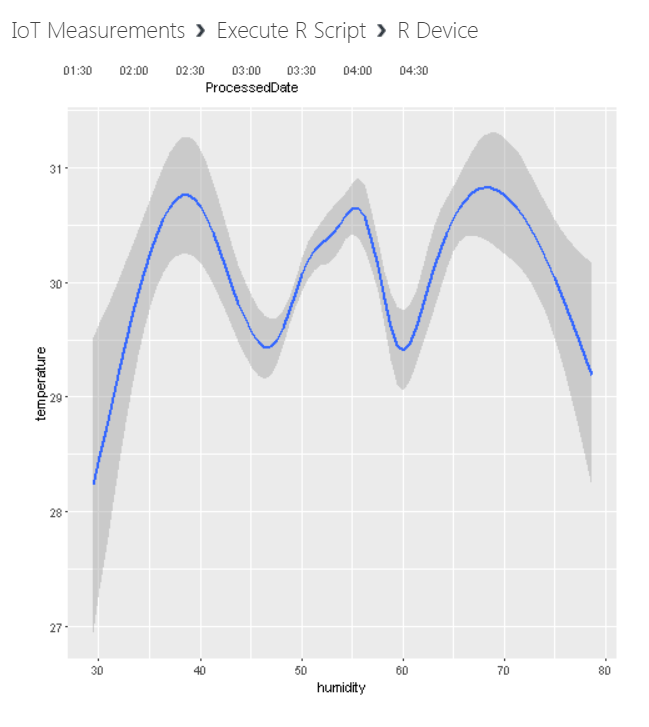
For Humidity:
For Soil Moisture:
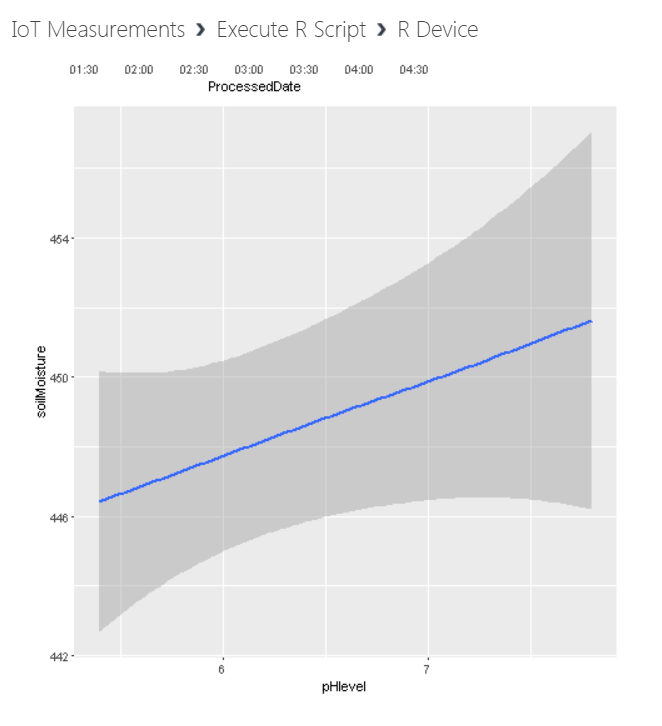
For pH Level:
I hope you found this blog post helpful. If you have any questions, please feel free to contact me [email protected]


