This blog is dedicated to leveraging the power of Power BI to create insightful financial reports. In this series, we will guide you through the process of building a balance sheet using data from Microsoft Dynamics 365 Business Central. A balance sheet is a crucial financial statement that provides an overview of a company’s financial position at a specific point in time, detailing its assets, liabilities, and equity. By harnessing the capabilities of Power BI and integrating it with Business Central data, you can streamline the reporting process and gain valuable insights into your organization’s financial health.
In today’s data-driven world, organizations need powerful tools to achieve data insights and interpretations to make quick and reliable decisions to benefit their businesses. Microsoft Power BI empowers data scientists, data analysts, and businesses to depict crucial data insights by providing a wide range of reporting and visualization tools.
Here, we will explore all the essential components and tools necessary for constructing a balance sheet report in Power BI Desktop. Additionally, we will utilize Dynamics 365 Business Central, a cloud-based solution, as the data source for our report.
Connecting Power BI with Dynamics 365 Business Central
- Sign in with your account into Power BI Desktop.

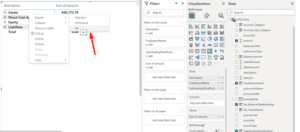
- After signing in, click on “Data and select More from the drop down.


- Then, click on Online Services, followed by Dynamics 365 Business Central.
- To connect the Power BI with D365 Business Central, we need to sign into the Power BI with D365 BC credentials.
- We can select data sources based on our specific requirements. For this purpose, we have opted for data sources from Web Services (legacy) that have been created through APIs in our Business Central instance.


Transforming and Refining Data in Power BI
We can transform our data based on the requirements. Here, we remove irrelevant columns from all the tables.
Click on Choose Columns from the Home tool.
- Click on Choose Columns again from the drop-down menu.
- Select the required columns and click Ok.
- Repeat the steps for all the tables if necessary, and then click on Close & Apply.


Note: We can apply various data transformations using the Query Editor to meet our specific needs. For instance, we have the flexibility to rename data, replace values, add additional columns, and eliminate rows. Furthermore, if necessary, any action can be undone by clicking on the “x” icon next to each step within the Applied Steps section on the left.
Building Relationships Between Tables in Power BI
- Navigate to the Model View on the right side and establish relationships between the tables by either dragging and dropping or using the Properties option on the left side.

Calculated Columns in the Power BI Data Model
- We require certain columns from both the “KSPGLAccount” and “KSPG_LRegister” tables within the “KSPGLEntry”. As a result, we incorporate calculated columns into this table within the Data Model.

- Below are the names of all the calculated columns:

![]()
Matrices in the Power BI Report Section for the Balance Sheet
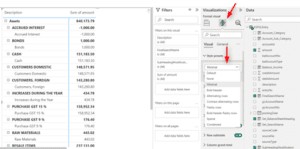
- Go to the Report Section and choose Matrix from the Visualizations section.
- Drag the required columns from the table and drop them under Rows.

- Similarly, repeat the step for all the columns. We can rename the column name, expand or collapse the entries in the matrix.

- Then, we choose Matrix Style by clicking Format the Report Page icon.

Applying Filters and Drill-Down in Power BI Reports
- We can apply filters to date and amount in the Filter Section.
- After applying filters, right click on the year and click on Drill down to see the detailed report.

Enhancing Matrices in Power BI with Custom Formatting
- Edit the Matrix by going to the Format your visual. You can modify font size, color, style, headings and much more.
- Here, we have made the column headers bold.

- We can change the size of the canvas by clicking on Custom under Type in Canva Settings.


Enhancing Reports with Additional Data Sources and Image
Additionally, we have the capability to incorporate data sources within the midst of a report. For instance, we can include the “companyinformation” table to present company-related information within the report.
- For this, we repeat the same steps for getting the data source. Here, we do not need to transform the data, so directly click on Load.

- To display the company logo, navigate to the Insert tool.
- Click on Image
- Select the image, and then click on Open.

- Subsequently, we utilize the Card visual to showcase the company’s name. The formatting of the card can be adjusted to meet specific requirements through the formatting tab in the Visualizations section.
- Now, we use Text Box to insert the company details.


Publishing and Interacting with Power BI Reports
- Click on the File tool at the top left and click on Publish followed by Publish to Power BI.
- Select My Workspace.
- Visit Power BI online, navigate to My Workspace, and access the report online. Additionally, you have the option to export the report to PDF.


Once you click on the report within your My Workspace, the report will immediately appear in a new window for your viewing and interaction.

Final Words
In the concluding section, we’ll recap the key takeaways from the blog and emphasize the value of Power BI in transforming raw data into actionable insights. Through the fusion of Power BI’s analytical power and the wealth of data provided by Microsoft Dynamics 365 Business Central, we’ve transformed the numbers into narratives.
Power BI can be utilized for designing interactive reports that can transform tedious financial analysis into stimulating reporting. Here’s how we achieved it:

From formulating financial reports to creating captivating visual representations, we’ve uncovered the capabilities of Power BI as a potent asset for effective financial reporting. We’ll encourage readers to continue their learning journey through online resources, communities, and continuous practice.
And if you need any further assistance, feel free to Contact us or email us at info@kaispe.com.
Written by:


