In an study with different schools, teachers shared how high attrition rates affect classroom learning and culture. An unstable living environment may cause students to be often late, missing classes or changing schools, although teachers say they try to reduce distractions, such as using mindfulness technology in academic classes however student churn is still a problem that exists.
As a technology solution provider, our focus is to help schools reducing the drop out rate using technology. For this purpose, we will be using Machine Learning (AI) to predict the student churn and identify dropout students at an early stage.
We will be walking-through an experiment on Azure Machine Learning Studio that will help us to predict future student churn predictions.
In order to achieve our goal, we will be using Two Class Decision Forest algorithm for our solution that comes with Azure Machine Learning Studio. We will be using sample data for this experiment.
So, in the first step we will upload the data on Azure Machine Learning Studio in the CSV file format, where it contains historical data composed of attributes on various parameters such as:
- School Id
- Student Id
- Gender
- Subject marks
- Students performance
- Guardian
- Internet
- Number of absences
- Lack of awareness
- School performance
- Establishment year
- Health protected
- Continue or Drop (Target feature)
- First, open Azure Machine Learning home page and Click +NEW at the bottom of the window
- Select DATASET
- Select FROM LOCAL FILE

In the Upload a new dataset dialog, click Browse, and find the studentChurnPrediction.csv file you created.
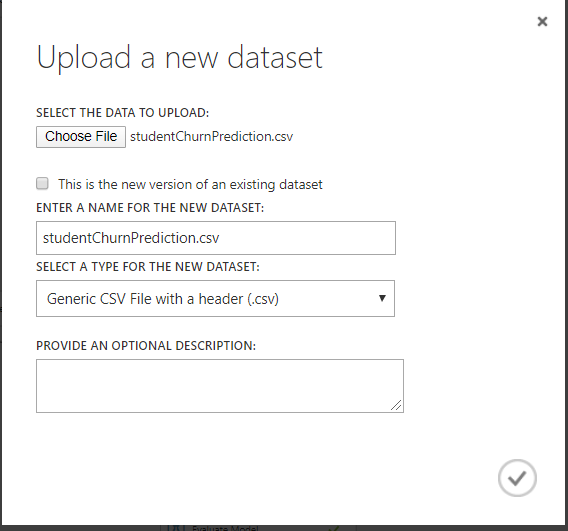
Now in the next step we will create an experiment in Machine Learning Studio that uses the data you uploaded. So, click +NEW at the bottom of the window and Select EXPERIMENT, and then select “Blank Experiment”.

Select the default experiment name at the top and rename it to KAISPE Student Churn Prediction and in the module palette to the left of the experiment page, expand Saved Datasets. Find the dataset you created under My Datasets and drag it onto the canvas.
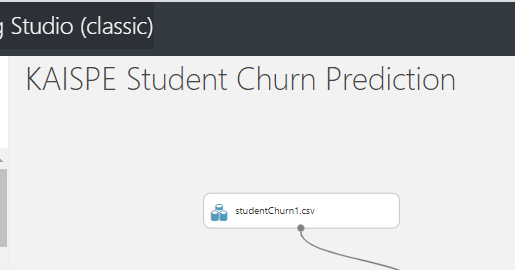
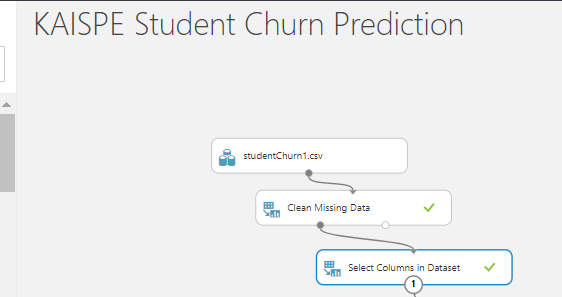
Now let’s prepare and clean the data by using Select Columns in Dataset and Clean Missing Data module which is useful if you want to clean and reduce the size of the data by deleting unwanted columns.
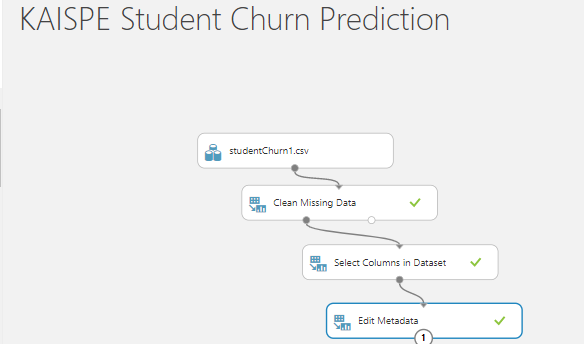
In addition, we will be using Edit metadata module which will help us to select categorical column in our dataset.
- Search and drag Edit Metadata and in the Properties pane to the right page, click Launch column selector and select the following categorical columns and make categorical.
Now, we’ll use our data for both training the model and testing it by splitting the data into separate training and testing datasets.
- Search and drag Split Data onto the canvas and connect to the last Edit Metadata module.
- Click Split Data and in the Properties pane to the right of the canvas and set it to 0.75. In this way, we will use 75% of the data to train the model and 25% of the data for testing.

In the next step we will be applying Two Class Decision Forest machine learning algorithm which is most suitable for our KAISPE Student Churn Prediction experiment.
So, in the next step we will find and drag the Train Model module to the experiment canvas.
- Connect the output of the Two Class Decision Forest algorithm to the left input of the Train Model module
- Connect the training data output (left port) of the Split Data module to the right input of the Train Model module.
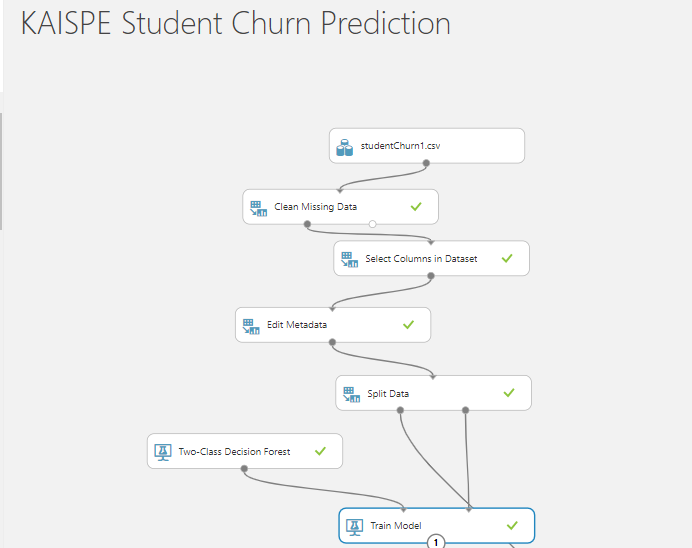
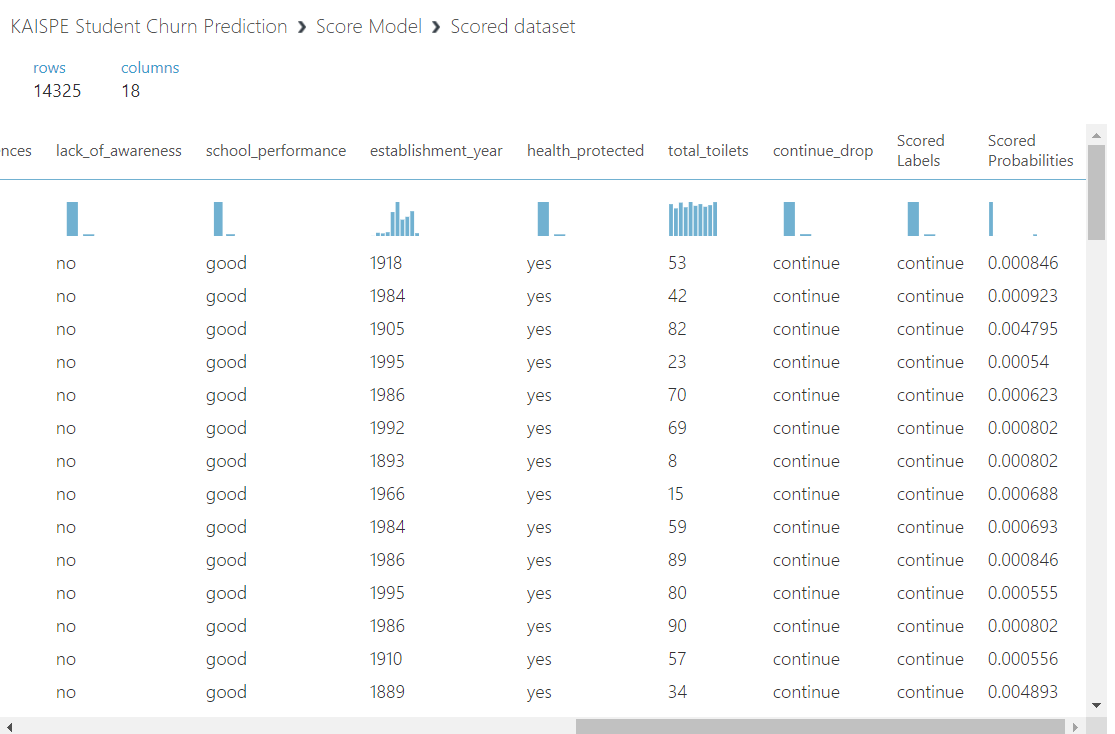
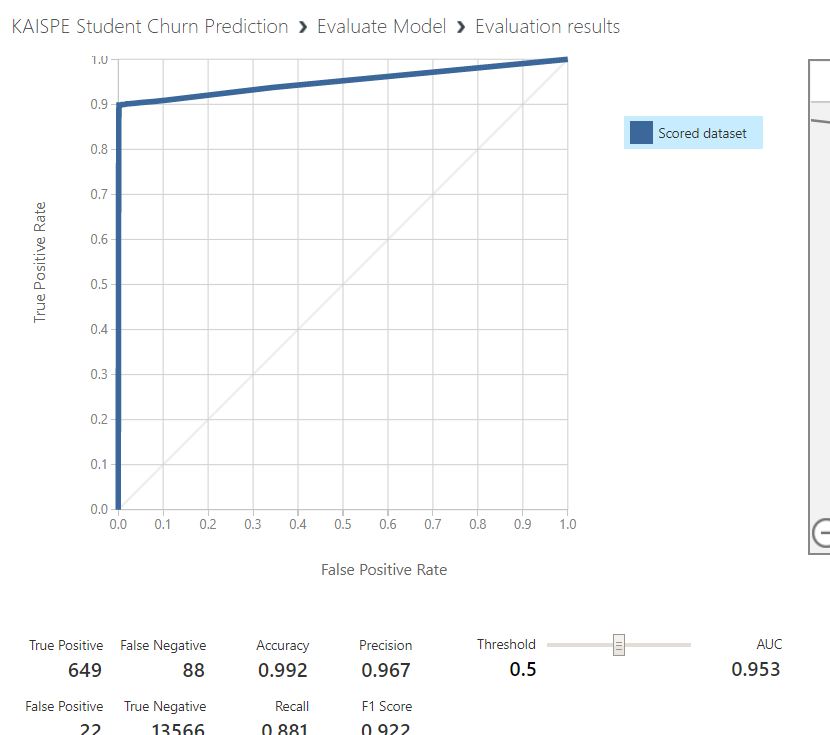
After successfully we have trained our model with 75% of the data, we can use it to score and evaluate model to check the other 25% of the data to understand the function of our model.
Now, we will be Running our experiment to Visualize the output of our Score and Evaluate the model.
I hope you found this blog post helpful. If you have any questions, please feel free to contact [email protected].


