Today I will walk you through how to create Microsoft Azure IoT Hub and communicate with the real world IoT devices.
First of all, we need to install the Visual Studio Code and Node JS to set up the Lab Environment. Then use the Azure subscription we have so we can create the Azure side of IoT components.
Afterward, we create a Resource Group and Azure IoT Hub service using Azure Portal.
Ok, now its time to set up the hardware and register it with IoT hub. For this post, we will be using Raspberry Pi 3. We need to install the OS Raspbian Jessie on our Raspberry Pi device.
To configure the connection string, I have used Visual Studio Code and make sure that my VS code uses the bash on Ubuntu (on Windows) shell in Integrated Terminal Panel. Below is the code snippet to get Raspberry Pi connected with IoT Hub:
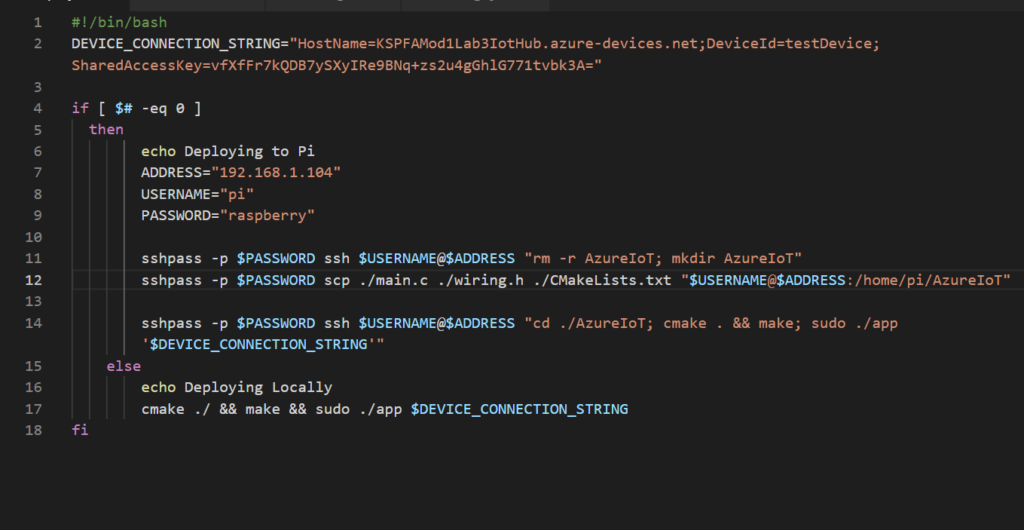
After we build and run the code, we must be able to send messages from Raspberry Pi to Azure IoT Hub as you can see below:
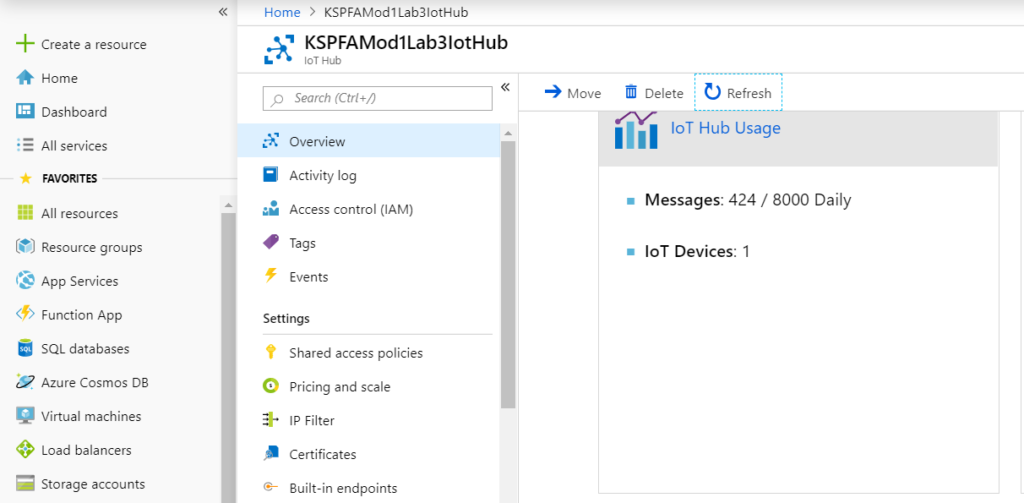
Awesome! Now as you can see the IoT Hub shows messages and a connected device, which in this case is our Raspberry Pi.
Now let’s connect a Photocell Sensor with our IoT device, so we can get some real data from the device. For this scenario, we are using the Light Dependent Resistor (LDR).
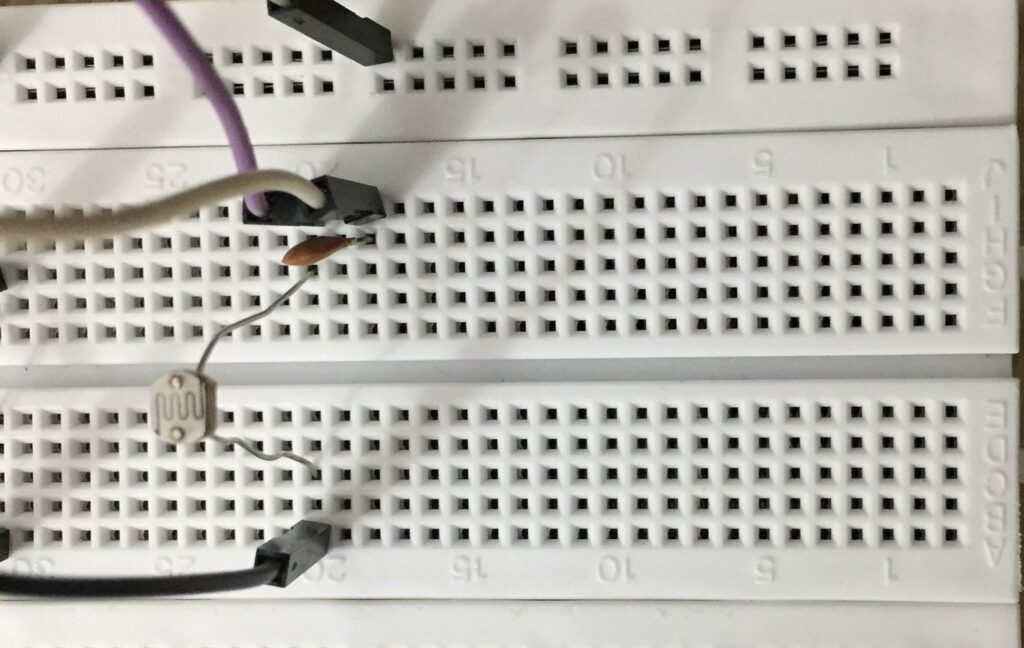
We will give different manual inputs to the sensor, so we can have brightness data to analyze.
Finally, we get reading from the photocell sensor to the cloud. However, we receive continuous data in the cloud as the sensor keeps emitting brightness readings and we cannot just use it as is, so how to handle it? We will use Stream Analytics that makes it easier to set up real-time data computation.
In order to configure Stream Analytics, we need to configure Input, Output, and Query to get the required data. We will also create a Service bus queue for data storage and perform Stream Analytics on it.
Stream Analytics Input:
Events from a data source are called Input. So, we will create a Stream Analytics Job in which we can use one of the following sources as an input for the Job.
- Blob Storage
- IoT Hub
- Event Hub
In our Scenario, we are using IoT Hub. IoT Hub is used to collect data from connected devices and provide two-way communication between Cloud to Device and Device to Cloud.
Stream Analytics Output:
Stream Analytics job takes incoming data and converts it to a stream of Data Output events. The processed data can be used on real time dashboard, to generate alerts or for batch processing.
Now let’s create a Stream Analytics job. We can use one of the following sources as Output for the job.
- Azure Data Lake Store
- Azure SQL Database
- Blob Storage
- Event Hub
- Table Storage
- Service Bus Queue
- Service Bus Topic
- Azure Cosmos DB
- etc.
In our Scenario, we will use Service Bus Queue. It offers FIFO (First In First Out) method and scalable message structure.
Stream Analytics Query:
Now the final part of our Stream Analytics Job is Query where we will specify the logic of our Stream Analytics job. The good thing is Stream Analytics Query syntax is very similar to the Structured Query Language (SQL), so you can easily write the queries here.
Our Stream Analytics query is:
SELECT
brightness
INTO
[ServiceBusQueue]
FROM
[Hub]
WHERE
brightness > 5

If we now run the Stream Analytics job, it will only show the data where brightness is greater than 5 and filter out the rest of the output messages.

So, as you can see above, it shows 80 input events and 44 output events because of the filtering we have done using Stream Analytics query.
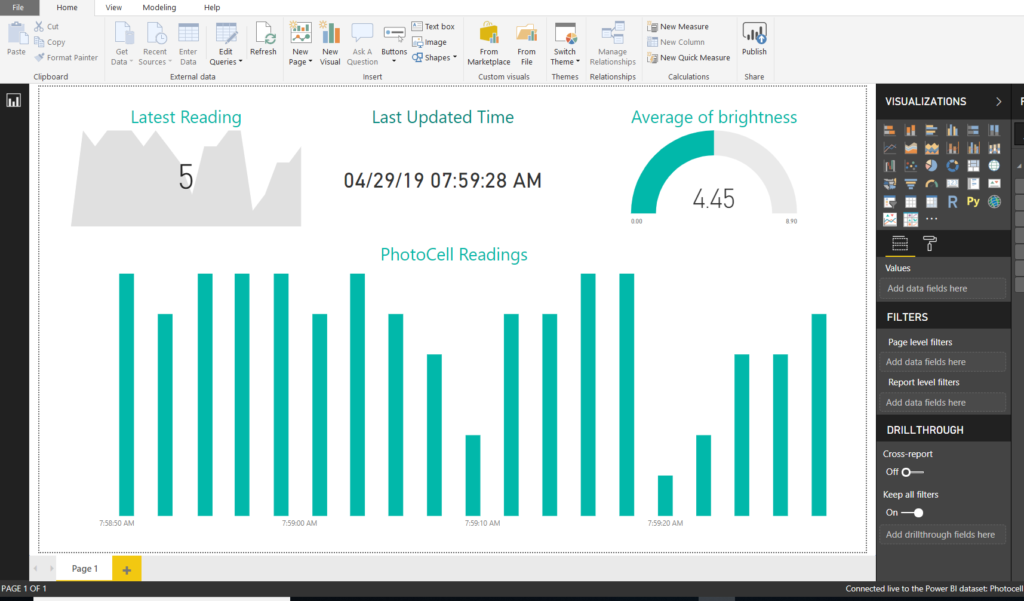
Next is we want to visualize the data using some kind of BI dashboard, so we can have better insights. For this purpose, let’s use Microsoft Power BI.
Following are the steps to create a Power BI dashboard:
- Create a dashboard using Power BI desktop application
- Add a Consumer Group to our IoT Hub. The consumer group is used by all applications to read data from Azure IoT hub
- Use the same Stream Analytics Job as we created above and have Power BI as the Output of job
- Once the above steps are completed, we can visualize Real-Time data into our dashboard
I hope you have found this blog post helpful. For any queries, please feel free to contact me [email protected].


